-
-
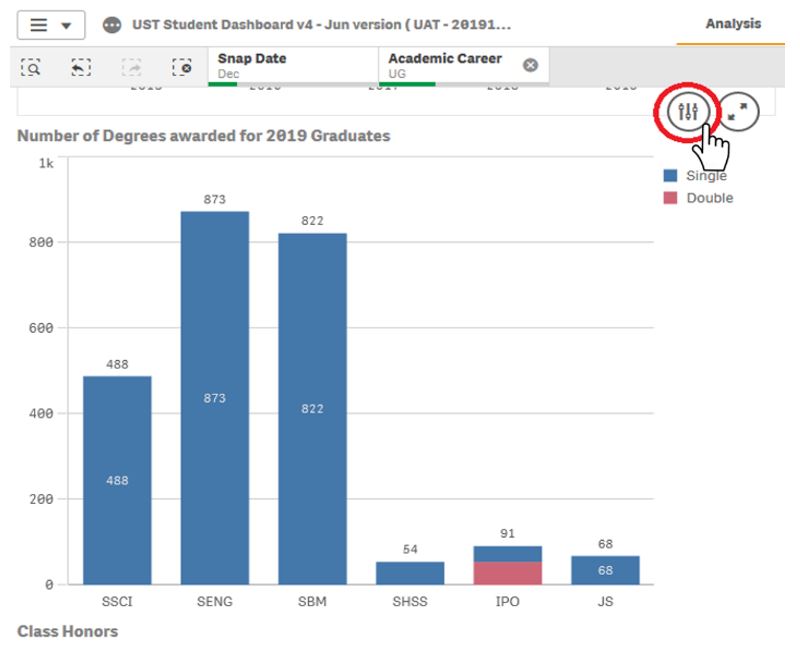
When the mouse pointer is moved over a chart, an “Exploration menu” button will be shown. Click on it.
Image
-
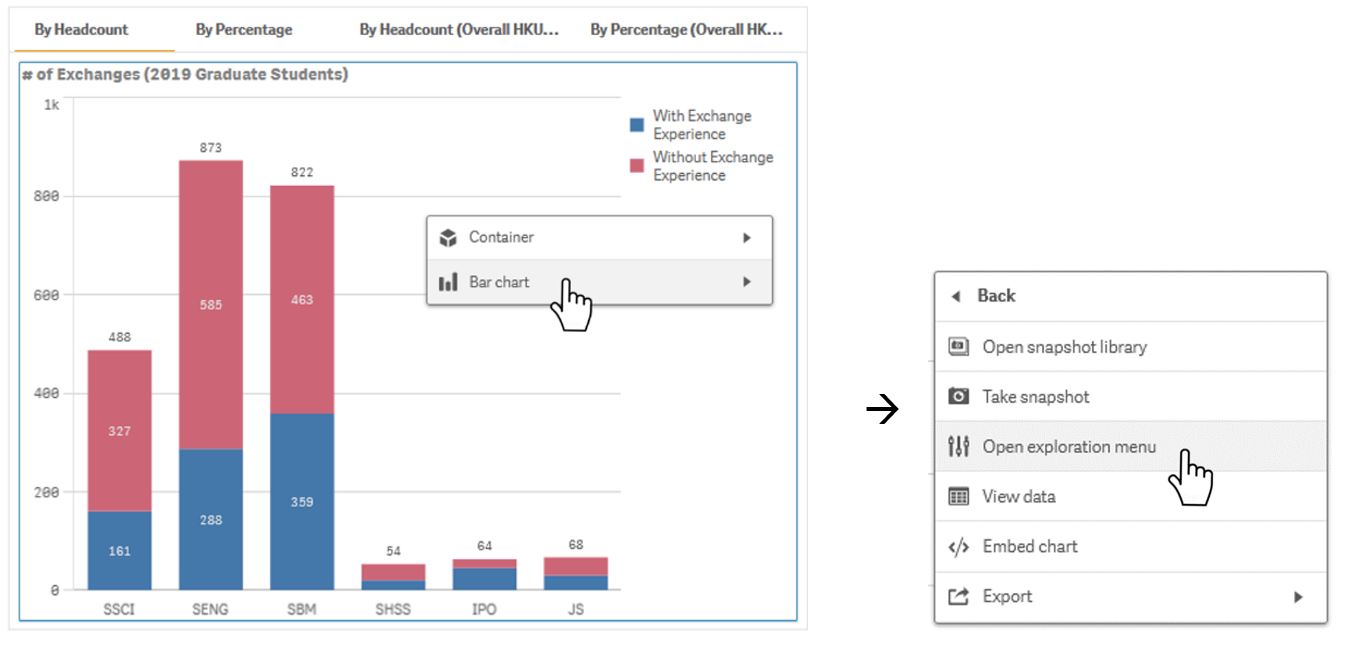
If the chart is a container, you need to right-click to select the chart to find “Open exploration menu”.
Image
-
-
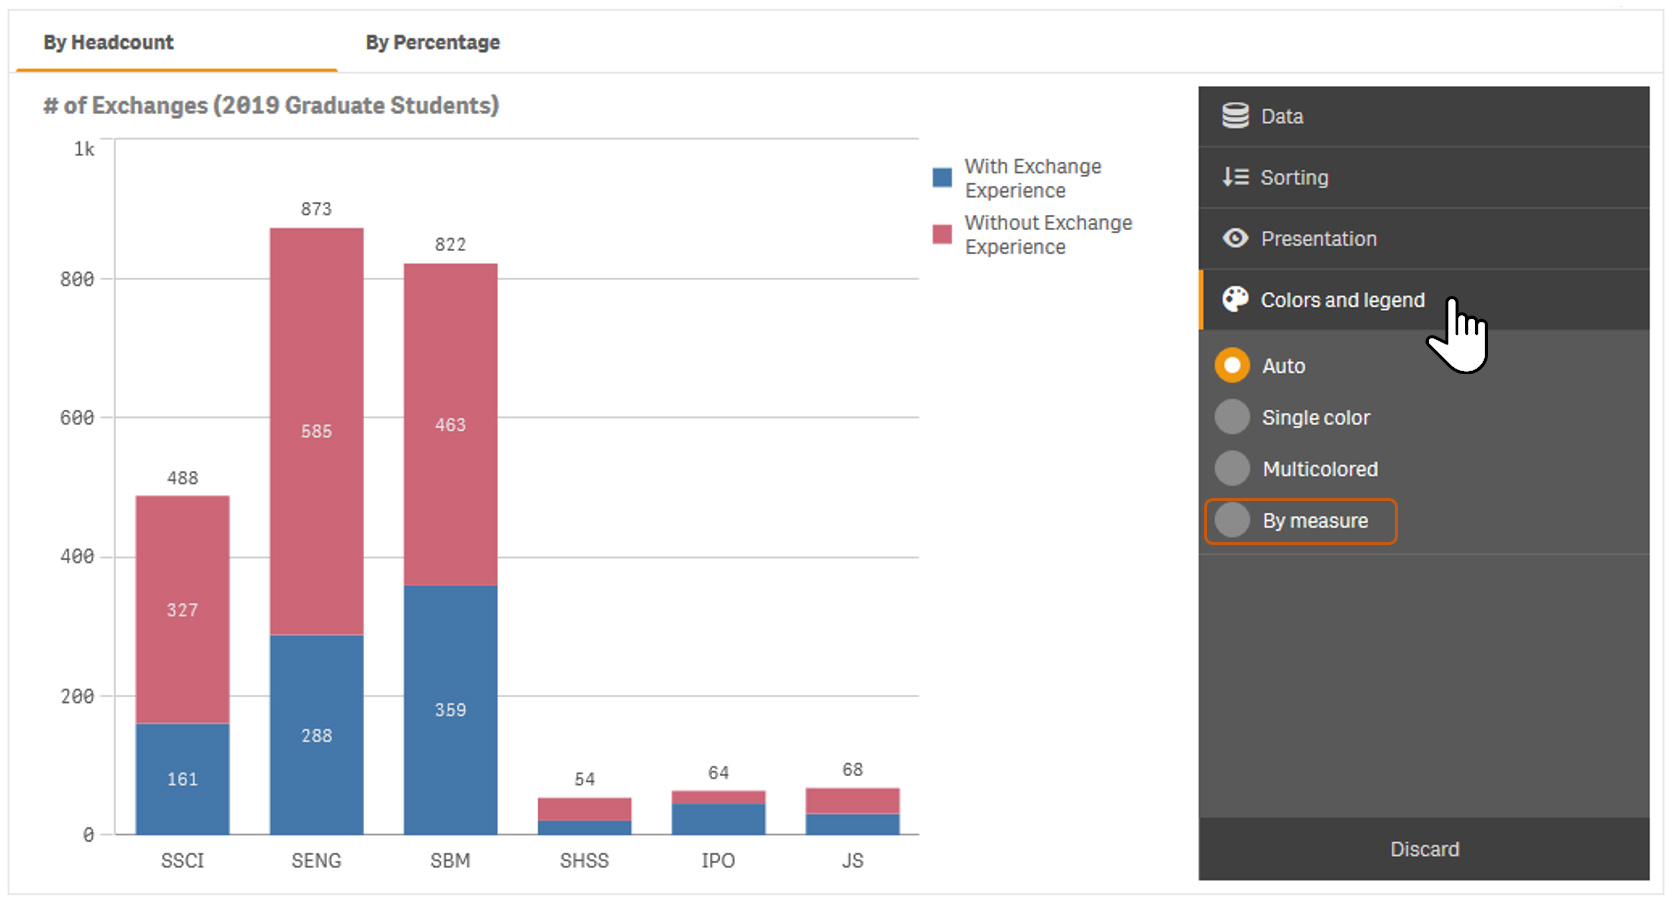
Click the Colors and legend tab. The chart color can be changed to “Single color”, “Multicolored” or “By measure”. Let’s try “By measure”.
Image
-
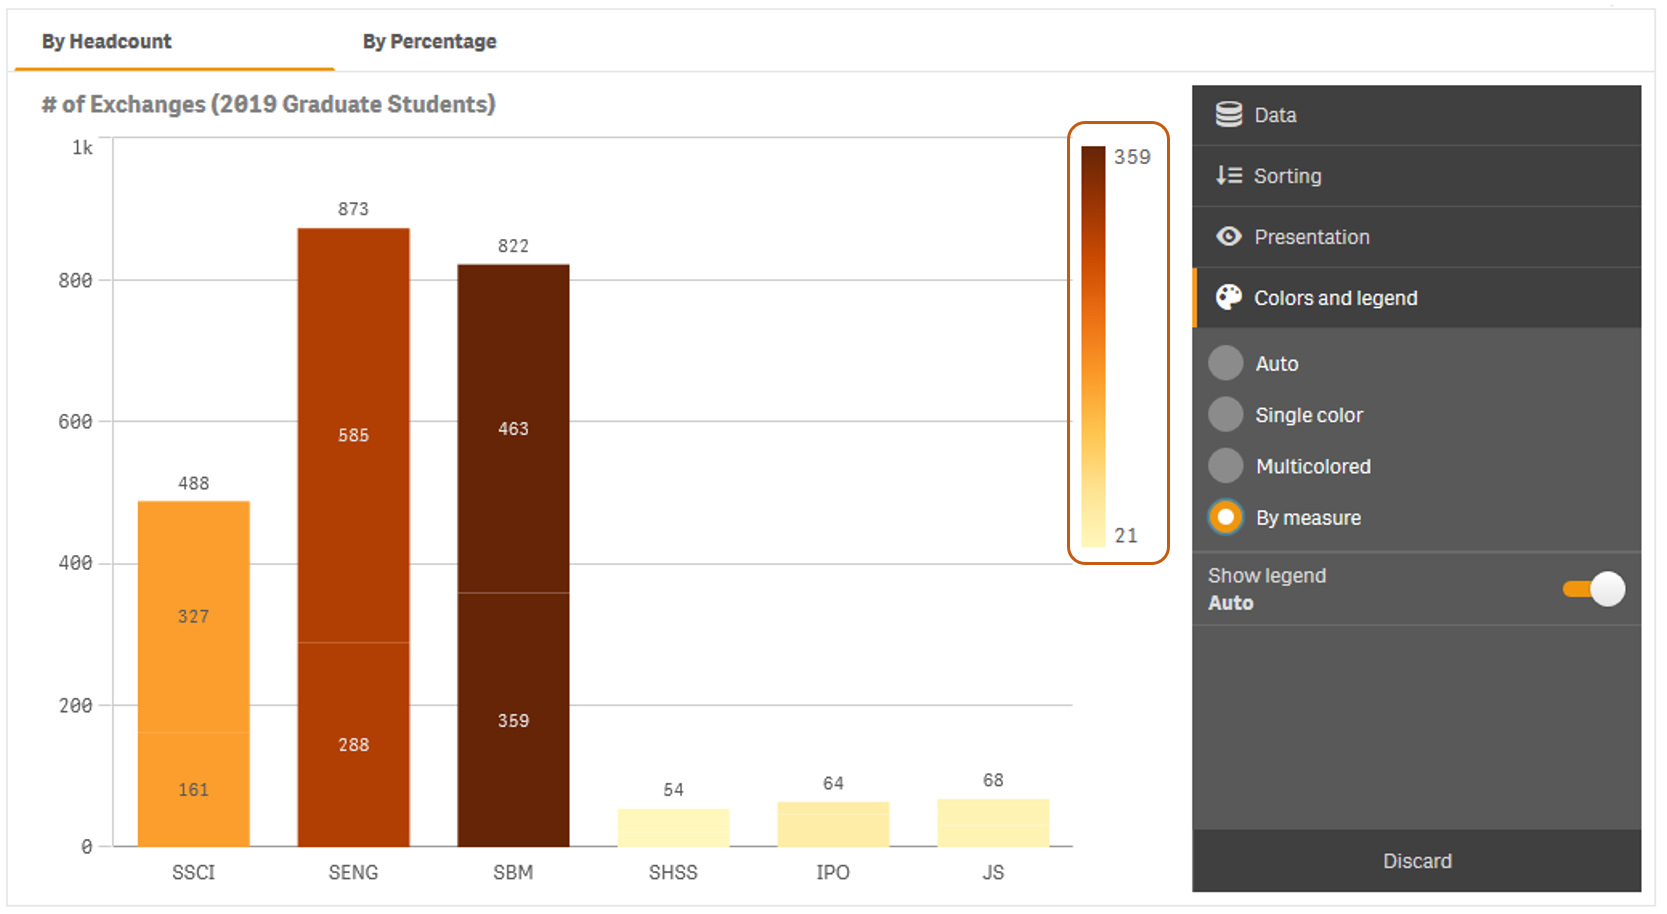
The chart color is by measure now. The legend shows the "# of Exchanges" by color.
Image
More about HKUST